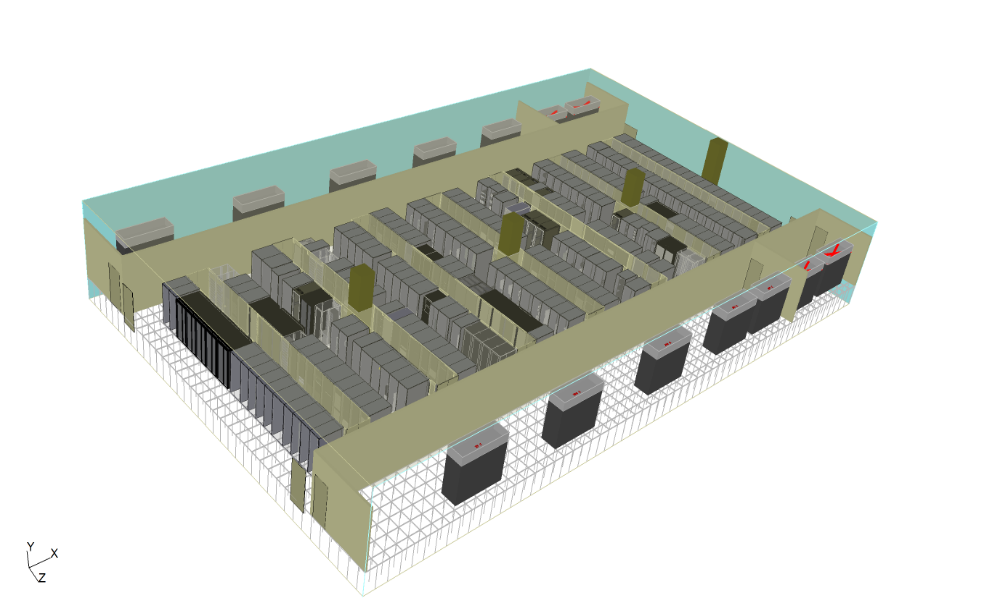
Enterprises Data Center manager decided to use Data center Optimization services to validate the present and optimum condition to run DC to save energy and check DC resilience
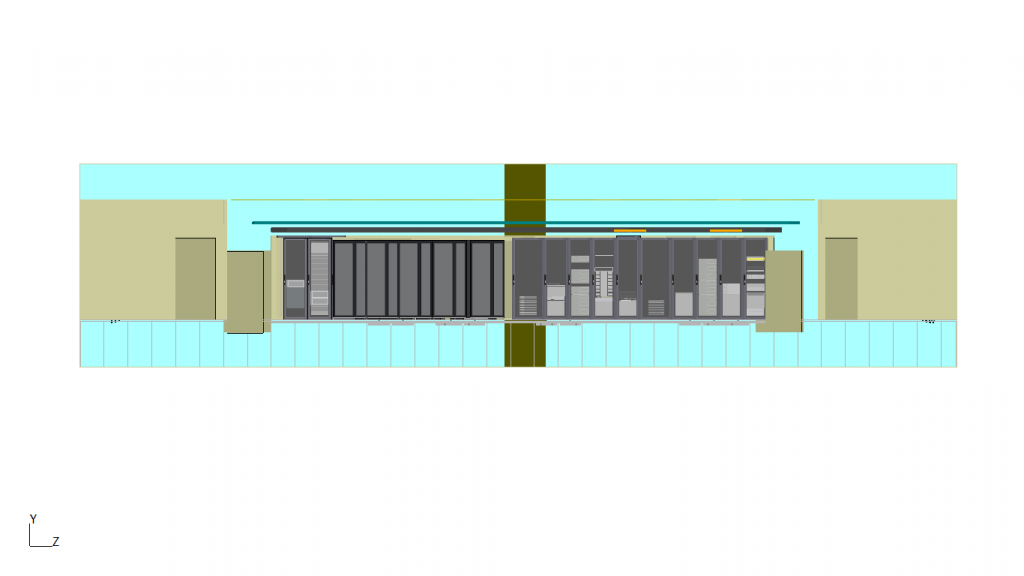
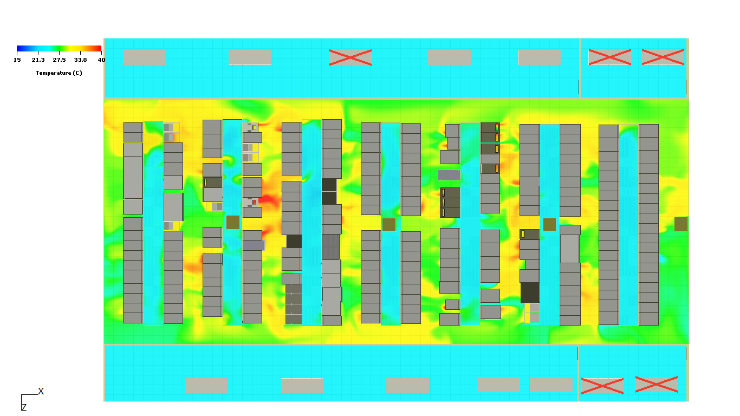
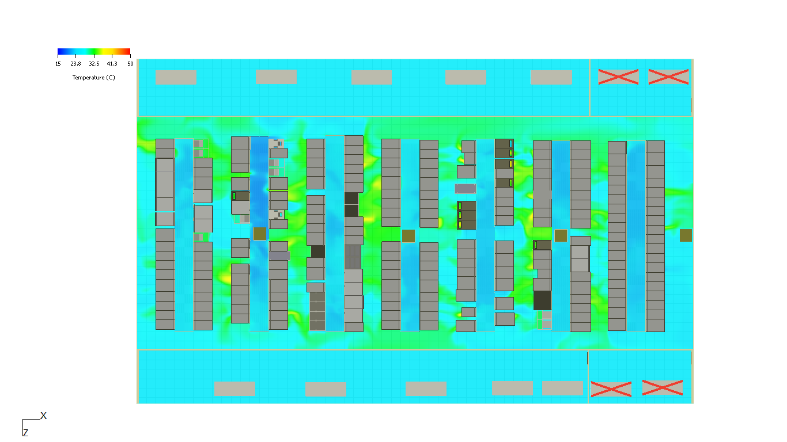
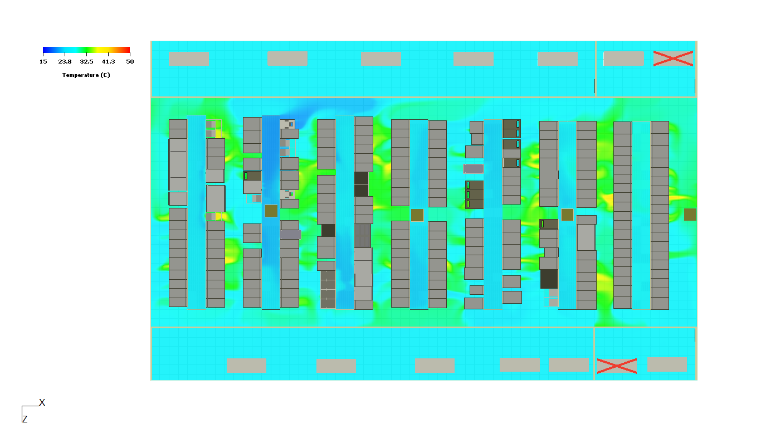
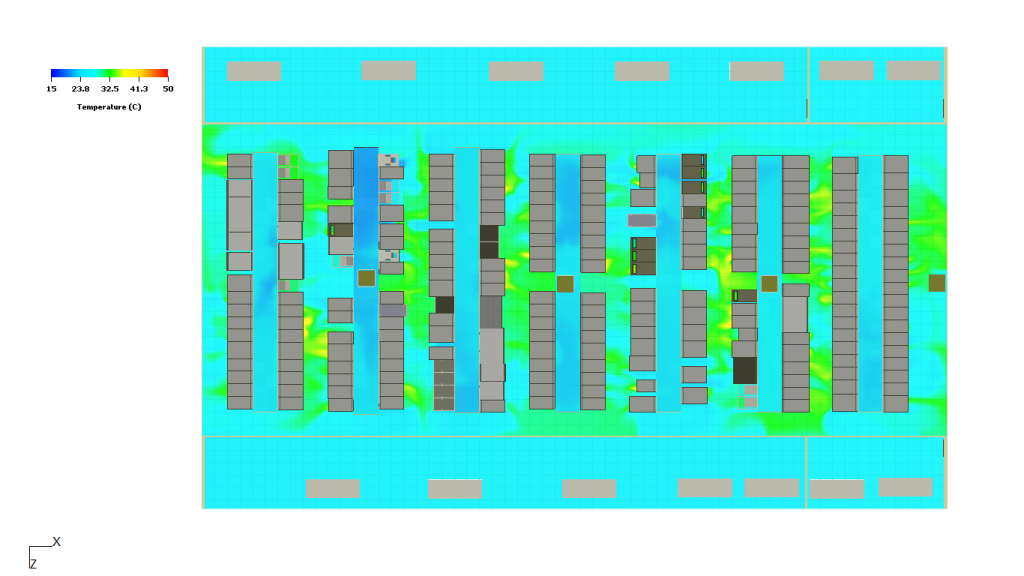
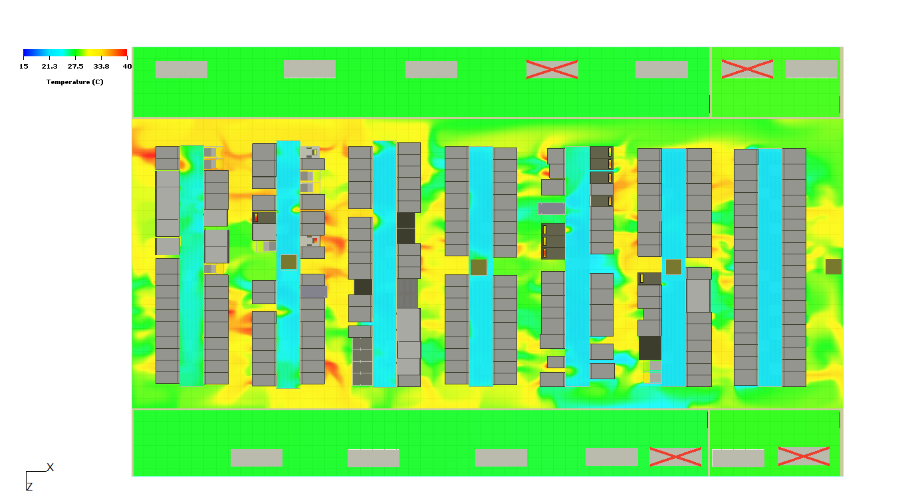
Temperature profile, Half of cabinet
Simulation condition-1
Simulation condition-2
Simulation condition-3
Simulation condition-4
Simulation condition-5
Simulation condition-1
Simulation condition-2
Simulation condition-3
Simulation condition-4
Simulation condition-5
Validation points
Simulation Condition
Intake Temp
Outlet Temp
Net Grill Flow
ASHRAE Limits
Over Heat Racks
Rack Temp Profile
Overall Results
1st Condition
✔
❌
❌
❌
❌
❌
❌
2ndCondition
✔
❌
❌
❌
❌
✔
❌
3rd Condition
✔
❌
✔
✔
✔
✔
✔
4th Condition
✔
❌
✔
✔
✔
✔
✔
5th Condition
✔
❌
❌
❌
❌
❌
❌
Note: 3rd Condition is better to control the present IT load as compared others
Our Recommendations
Use 12 PAHU units to control present 906kW IT load to avoid overheating of racks as exhaust temperature is high
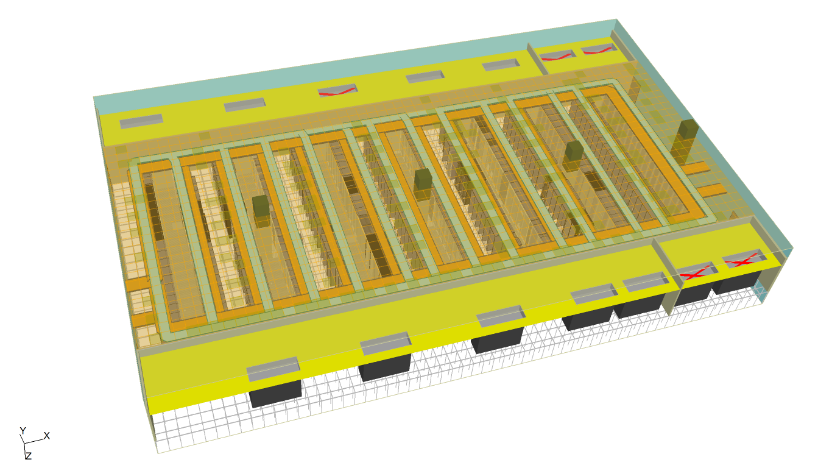
Install few more supply grills to increase the CFM flow and air pressure in the cold aisle containment
Use blanking panels in the all racks to avoid air mixing and recirculation
You can add only 8 to 12% additional IT load but challenge is cooling availability if 4 PAHU units fails simultaneously at a time
Summary - Benefits
Visualized the thermal profile of the data center on present IT load
Visualize hot and cold spot’s in the data center
Visualized the thermal profile of the data center on present IT load with increased in cooling capacity
Visualized the scenarios to ensured the optimum design from airflow point of view
Demonstration of designed performance of DC up front with varying IT loads
Data center flexibility in absorbing future IT expansion
Predict the failure scenarios to check the data center resilience (redundancy).