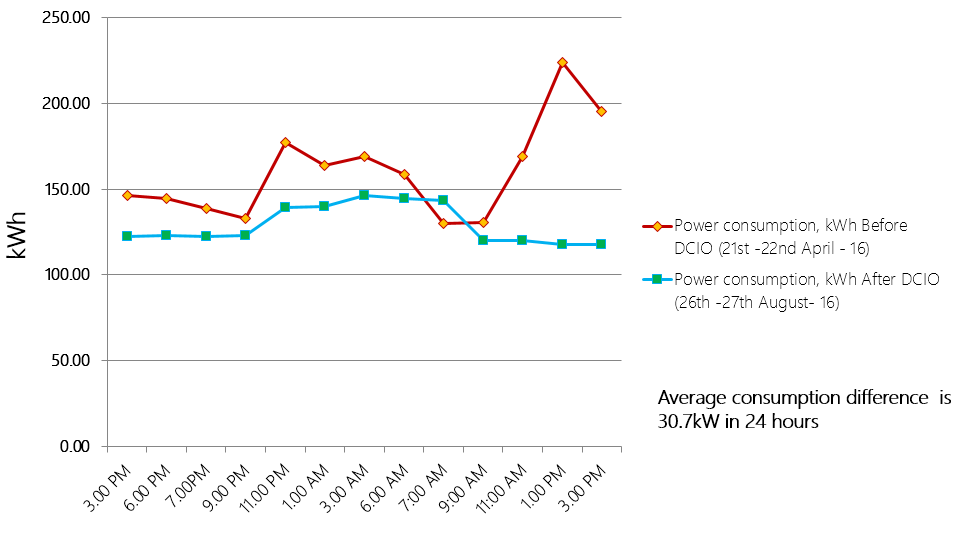
Increase energy efficiency hence save energy cost without affecting the performance of the data center (with commited ROI of 16.5months)
Effective utilization of delivered air flow to the grill level
Reduces the wastages and re-circulation of cold air
Actual rack power consumption and recovering lost rack capacity
Ensure the uptime/availability of IT by avoiding downtime
Effective utilization of data center white space and rack “U” space
Energy efficient data center with optimal utilization of capacity
Predict the impact of cooling failure on the data center resilience (Transient analysis)
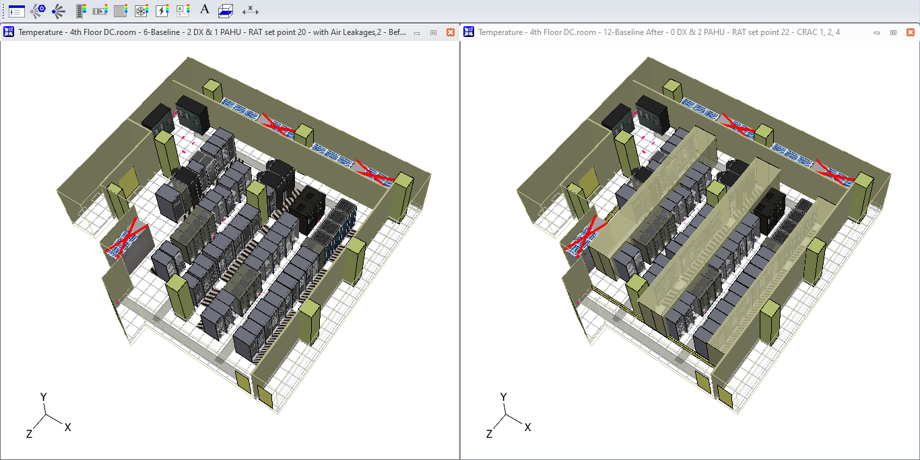
3D Virtual facility
Lets validate 2 simulations scenarios in terms of cooling efficiency (temperature and CFM) with benchmark parameters
Before recommendation
After recommendation
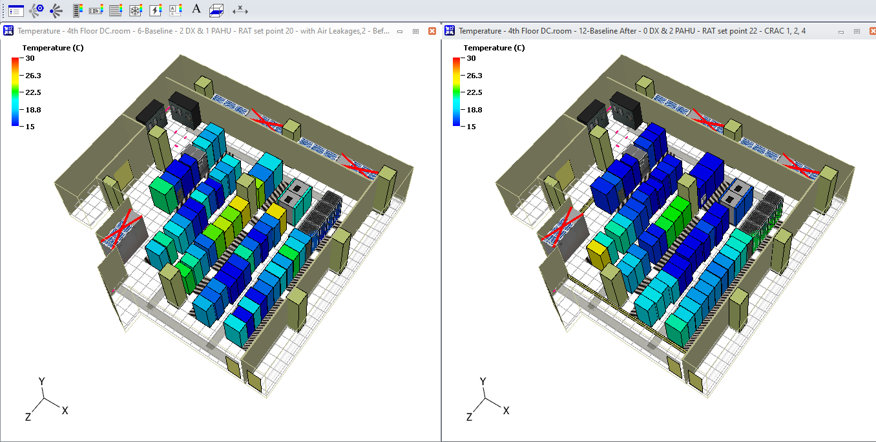
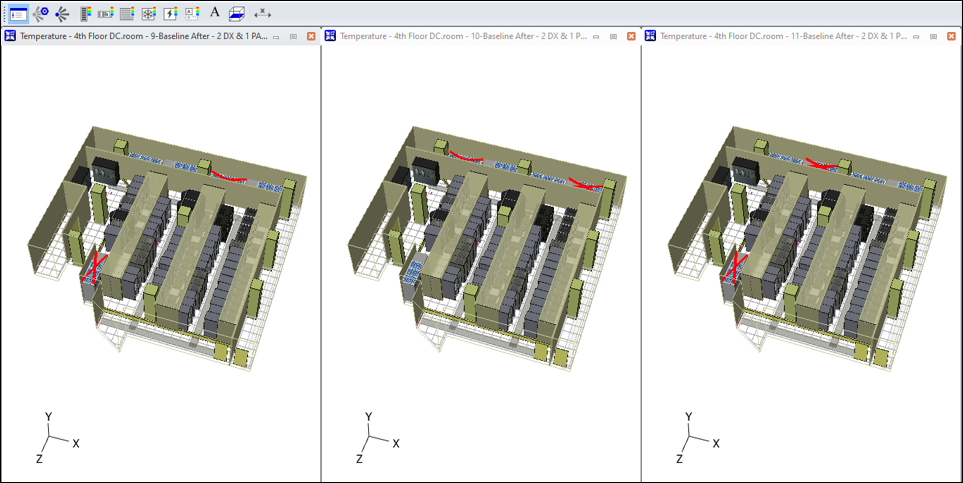
Rack mean inlet temperature
Rack inlet temperatures are high in some of the racks
Rack inlet temperatures limits are acceptable
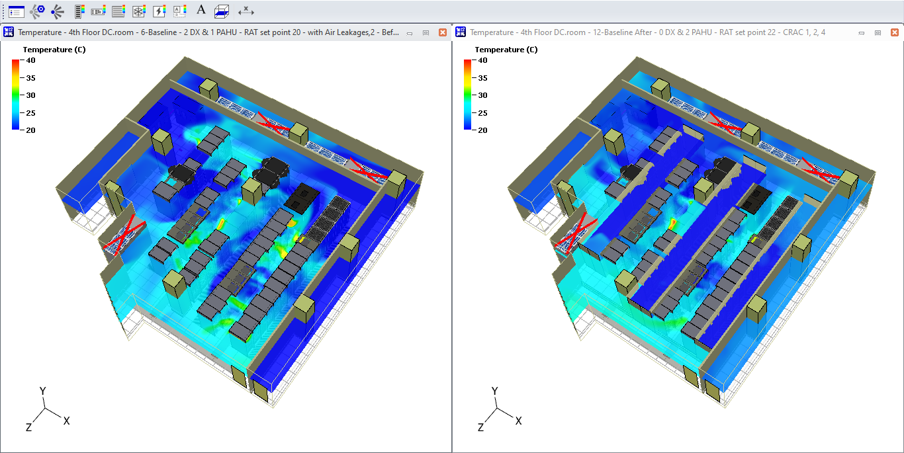
Thermal profile – Top of cabinet
Huge amount of air mixing & hot air short-circuiting
Less amount of air mixing
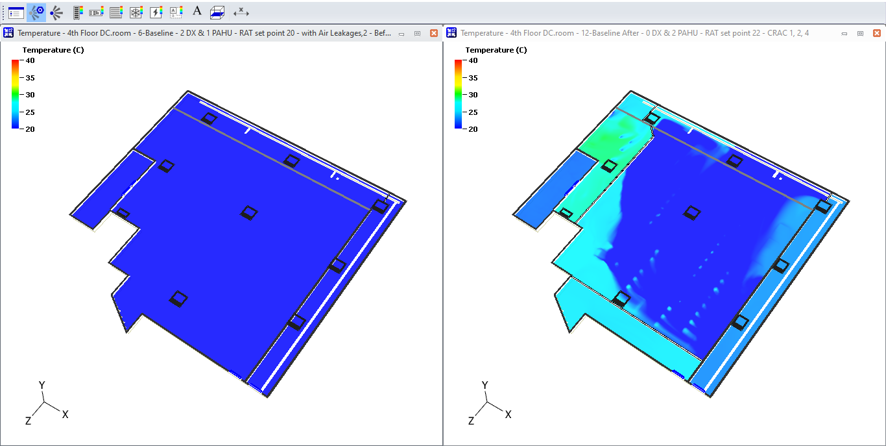
Floor void temperature
Cold air is covering entire false floor area which results to low CFM delivery
Cold air is not covering entire false floor area which results to high CFM at grill level
3D Virtual facility
Lets validate 3 simulations scenarios in terms of cooling efficiency (temperature and CFM) with benchmarking parameters
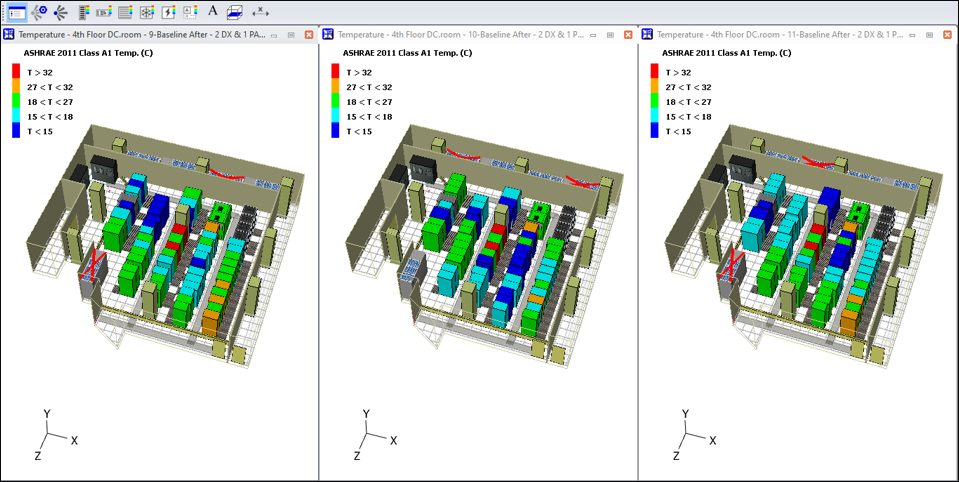
ASHRAE limits – Temperature
Note: All racks temperature are within acceptable limits and rack no 25 & 27 are temperature is high and these devices are Cisco catalyst devices which throw the air at side of the racks
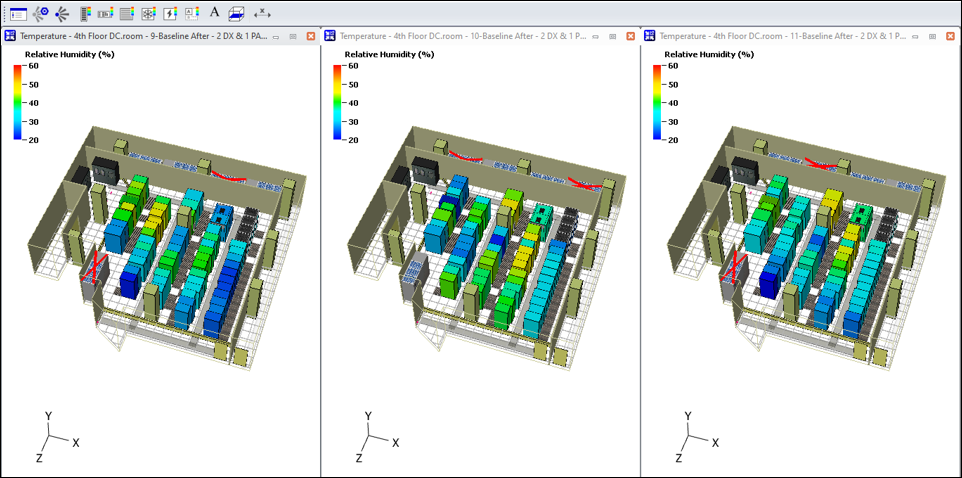
Relative humidity
Note: All racks humidity ranges are within acceptable limits